Electronic Supplement to Ammann-Wahl
Climatic Change (2007)

Reference:Ammann C.M. & E.R. Wahl, 2007:
The Importance of the Geophysical Context in Statistical Evaluations of Climate Reconstruction Procedures.
Climatic Change, 85:71-88. (DOI 10.1007/s10584-007-9276-x)

Published: © 2007, Climatic Change


See also: Wahl & Ammann, Climatic Change (same issue)


Color Versions of Figures in Climatic Change:

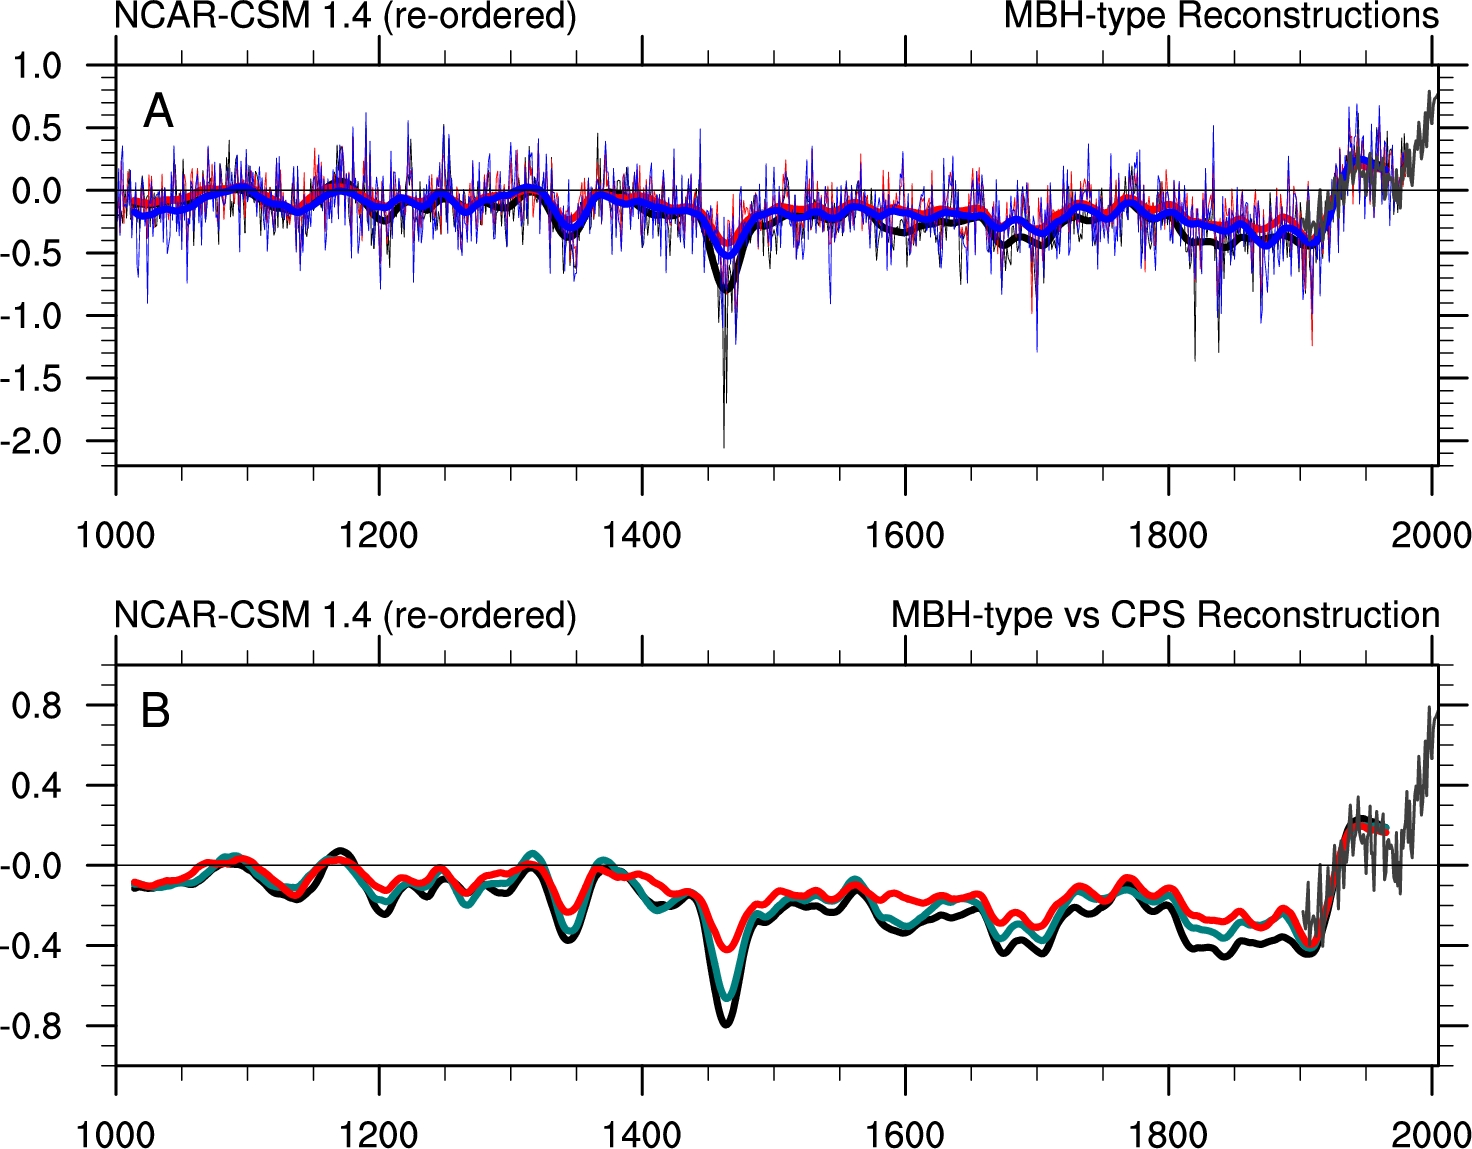
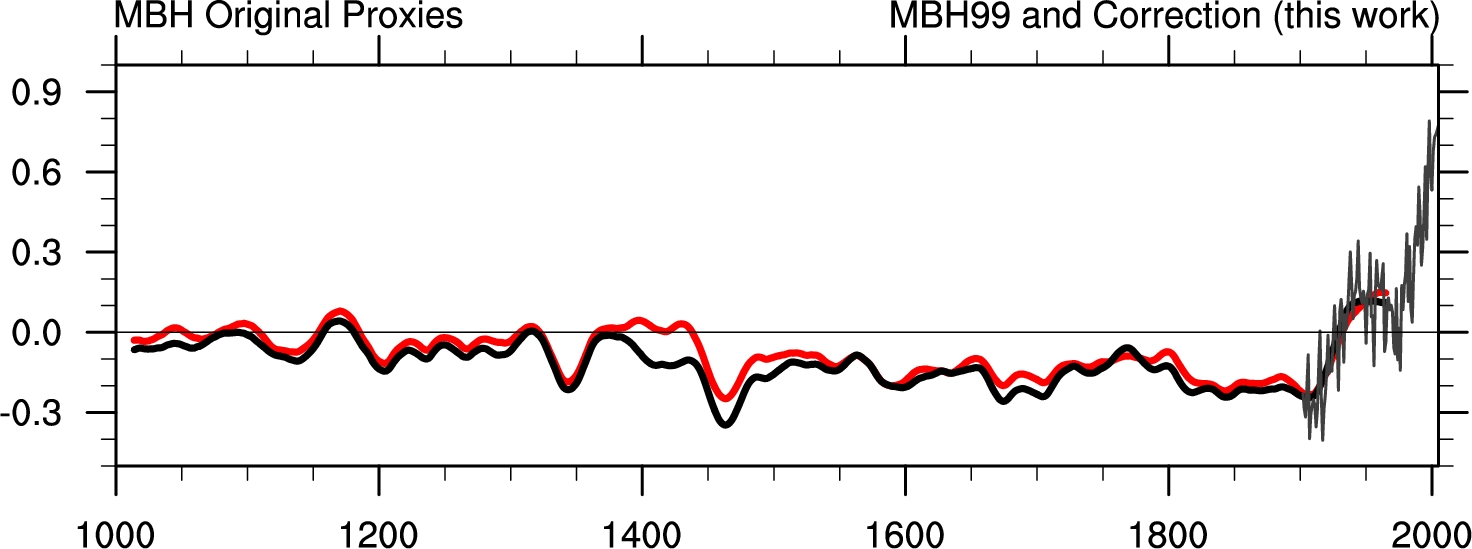
Figure 1 Figure 2: Correction of MBH (full long-term centering)


1. General Convergence of MBH Reconstruction

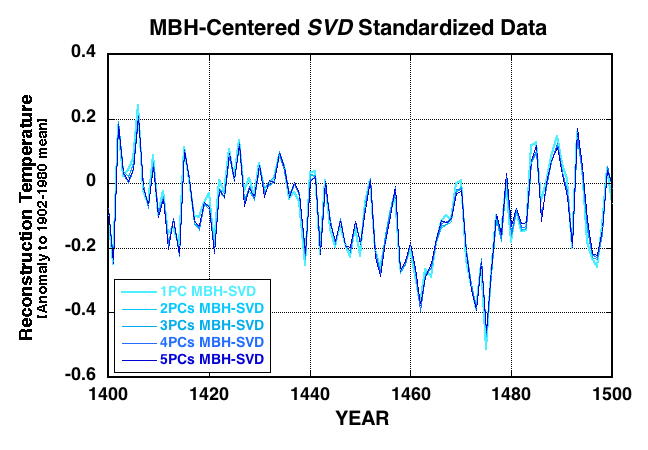
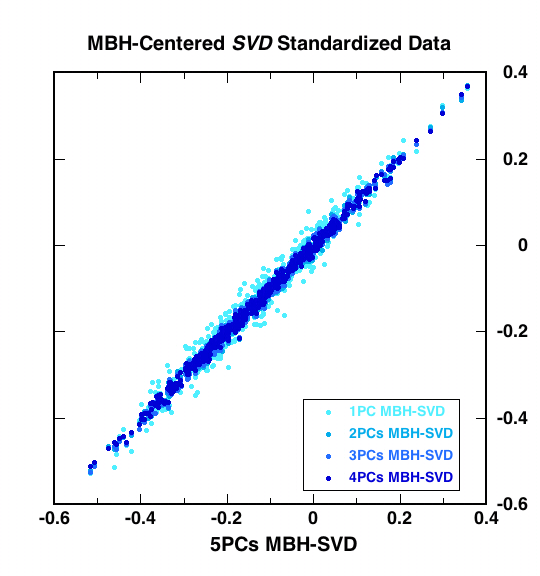
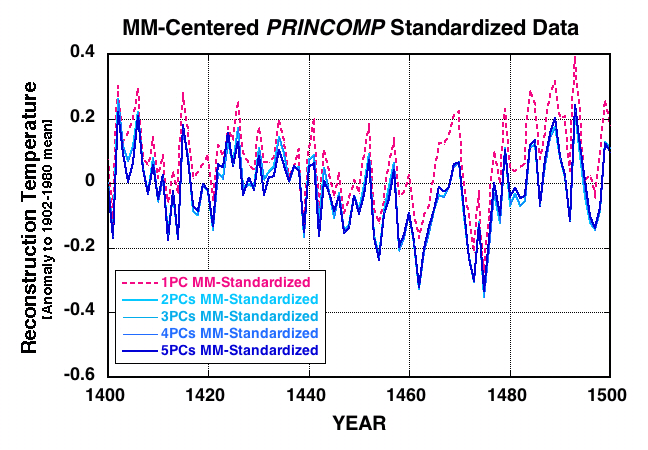
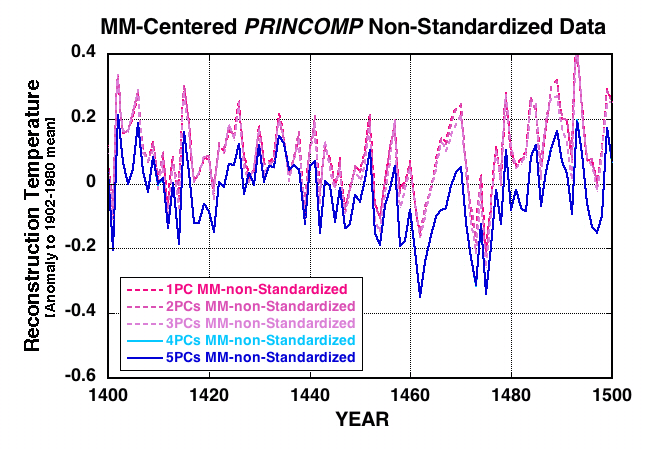
Figure S1 illustrates that the result of differing climate reconstructions using the same underlying N-American International Tree Ring Data Base (ITRDB) time series in the MBH algorithm context is due to a combination of choices for PC processing of the 70 time series involved. These choices are: 1) the use of non-standardized time series in princomp algorithm (R language); 2) employing the default option of the variance-covariance matrix for decomposition (note that the underlying tree ring series have standard deviations that vary by a factor of ~13); and 3) employing only the first two resulting PCs in the climate reconstruction. The first two choices together cause the PC analysis to first reduce the large difference in variance between the ITRDB series rather than to isolate common structures present over all the individual series. The third choice of only entering the first 2 PCs into the climate reconstruction then has the effect of truncating the underlying data (cf. Section 2 in this supplement). This truncation can be seen in the spread of reconstruction temperatures (bottom row of S1) that only start to converge after use of 4 or more PCs.
Reconstructions Convergence
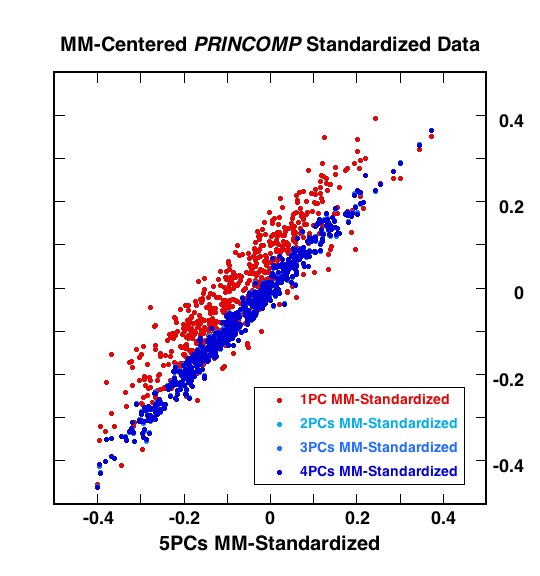
Figure S1:Three variants of PCs of the 70 N-American International Tree Ring Data Base (ITRDB) time series (scenarios 5a-d in the Wahl-Ammann companion article, with removal of the Gaspe tree ring series over 1400-1449) were entered into the Wahl-Ammann version of the MBH climate reconstruction. By successively increasing the number of PCs applied in the reconstruction all climate reconstructions are shown to converge towards a series similar to the original MBH reconstruction, independent of PCA method or centering convention. This convergence is achieved using at least 1 PC for the original MBH method (employing the svd algorithm with MBH-centering, top row), 2 PCs (employing the princomp algorithm with MM-centering, but using standardized time series, middle row), and 4 PCs (employing the princomp algorithm with MM-centering, using non-standardized time series, bottom row). The latter method is the one used by McKintyre and McKitrick (2005b, or "MM 2005b"), except that only the first 2 PCs were used in the reconstruction. Pink/red color shows the non-converged reconstructions, and blue color shows the converged reconstructions. The right-hand side for each panel is a scatter plot of the reconstructed annual values using 1-4 PCs for each case vs the reconstructed values using 5 PCs. The difference between the converged (blue) and non-converged (pink/red) reconstructions is apparent; as is the greater scatter of the non-converged reconstructions.


2. N-American ITRDB data and PC calculations

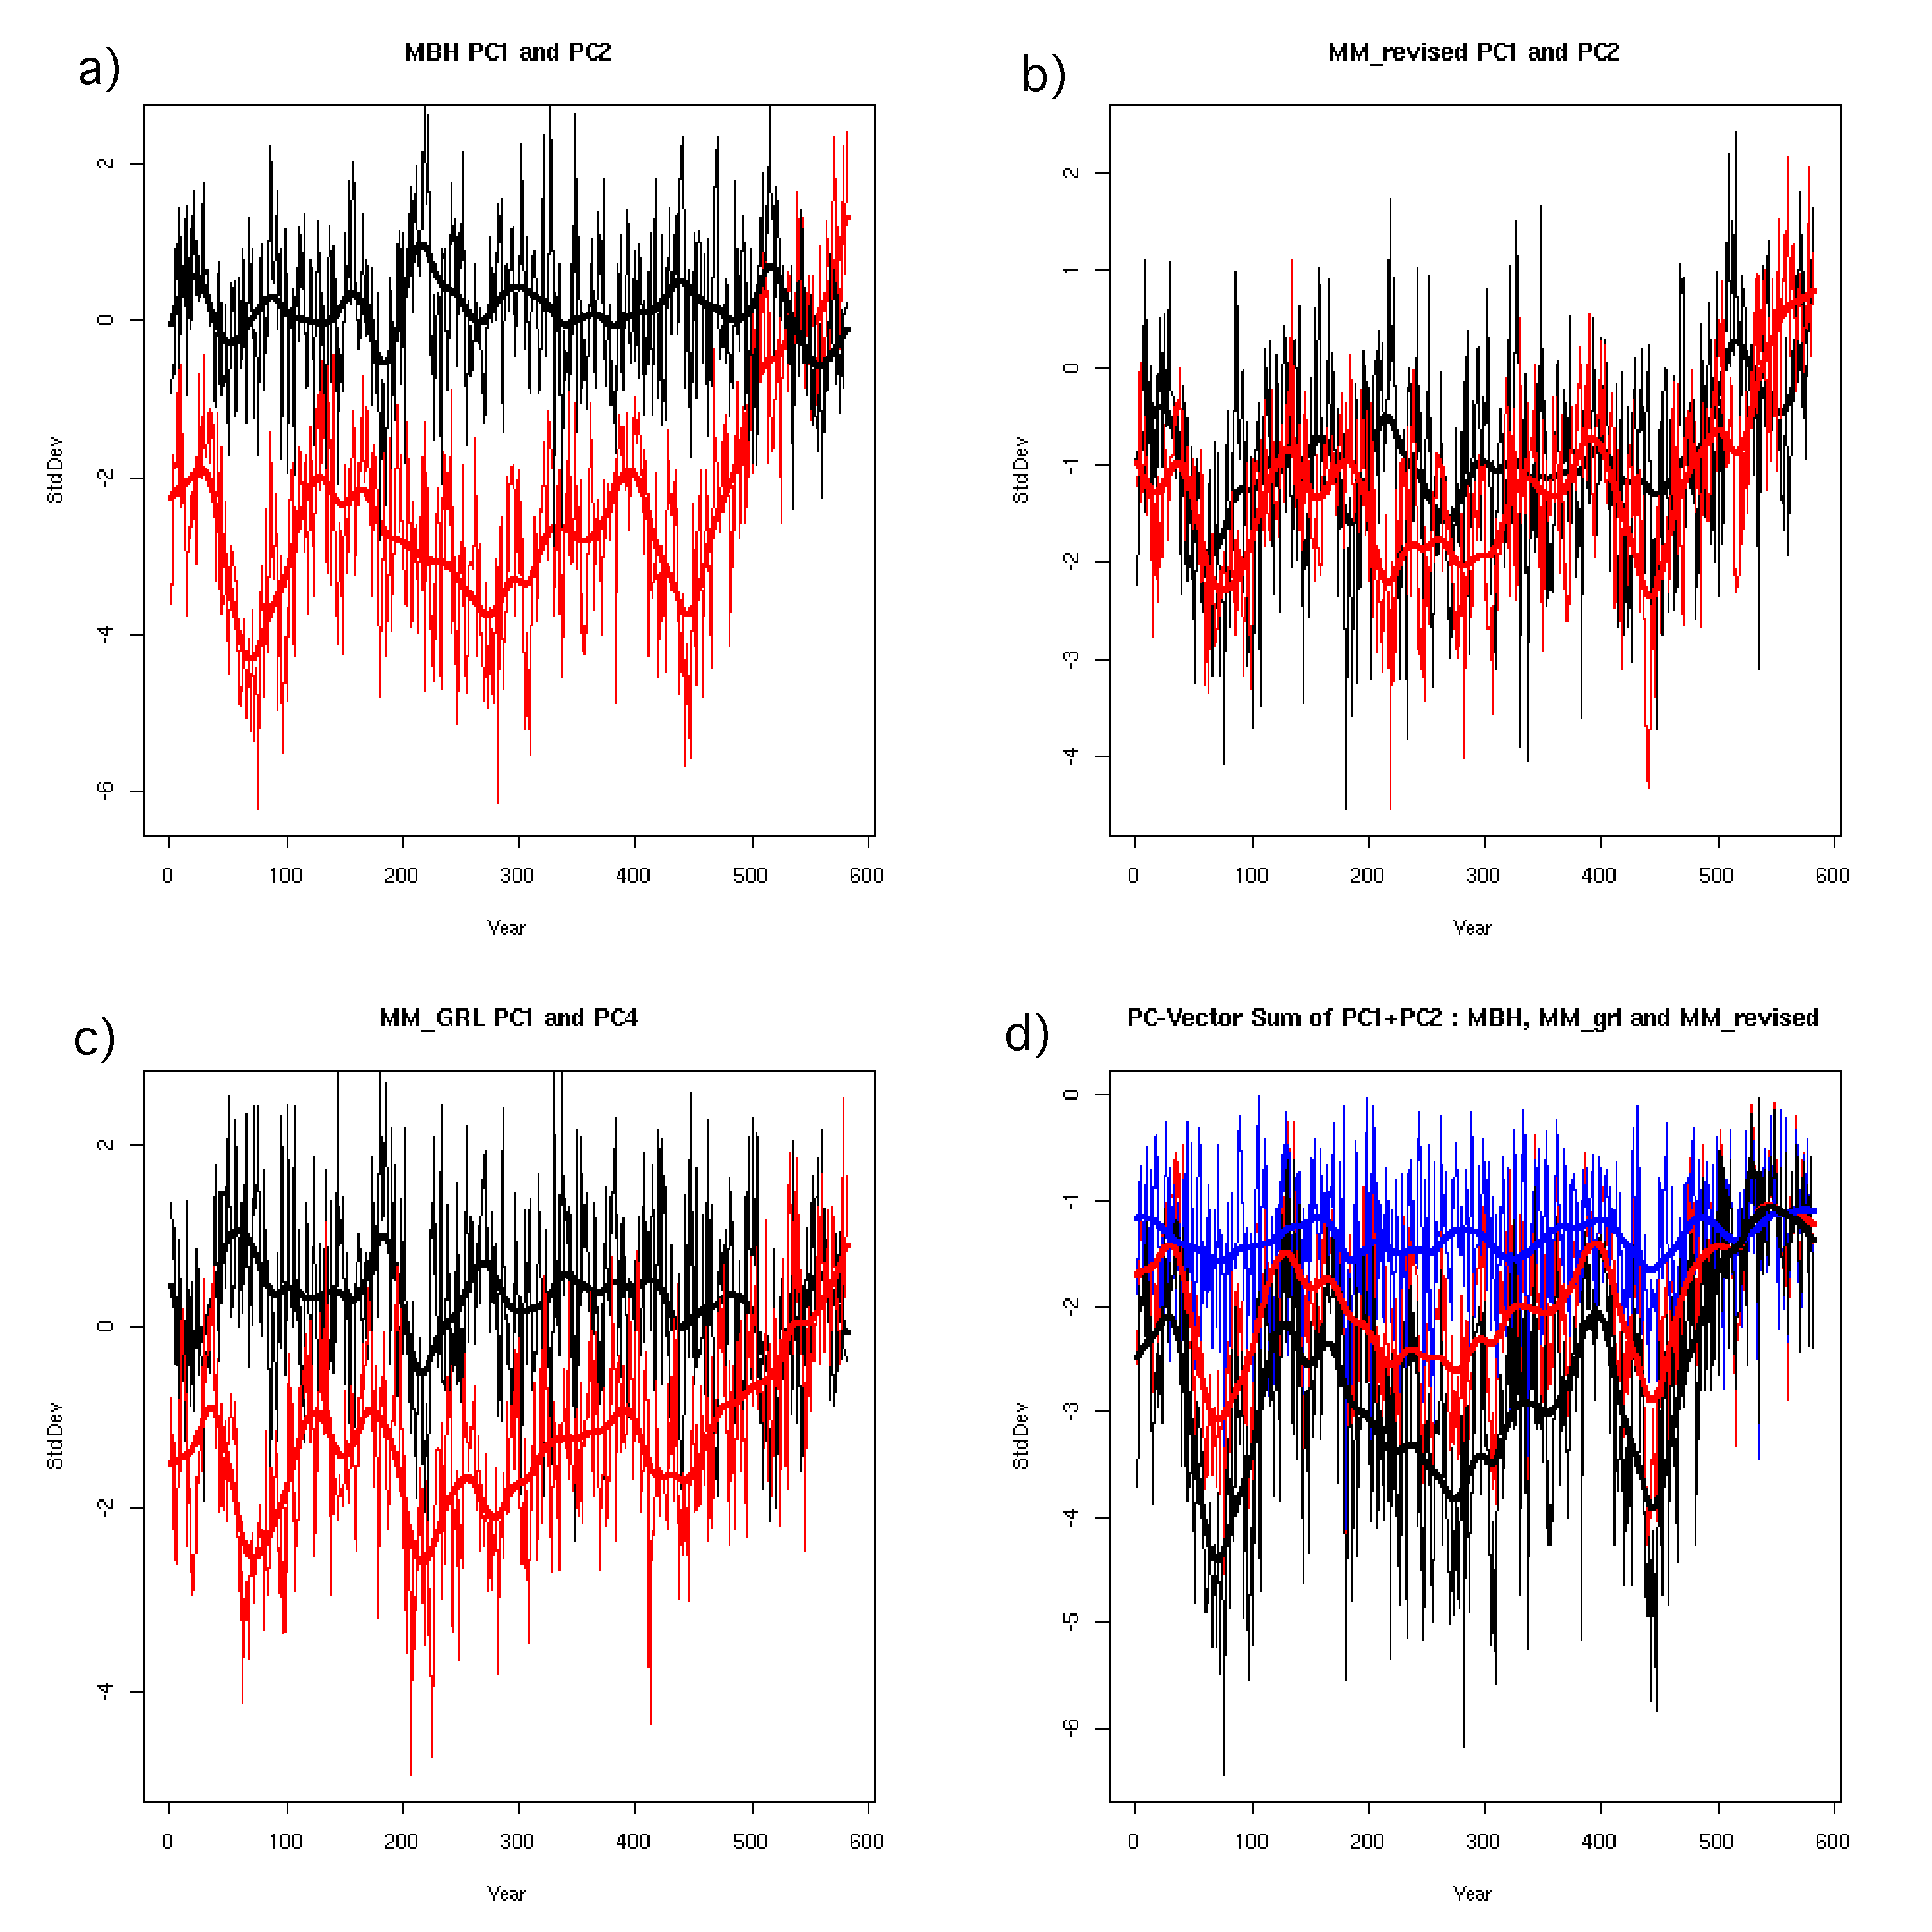
The change in spread of the information across different PCs can already be seen when looking at the PCs themselves. Figure S2 shows the calculated PCs 1 and 2 for (a) MBH and (b) MM-centering versions based on standardized data, as well as (c) PCs 1 and 4 for MM05a versions based on non-standardized data. The marked trend from the late 19th to the end of the 20th century is seen in PC1 (a, MBH), split between PCs 1 and 2 (b, MM-centering with standardized data), and in PC4 (c, MM-centering with non-standardized data, following MM05a).

MM05a and MM05b have commented that Bristlecone/Foxtail Pine (BC) records are mostly responsible for this trend. In their choice of PC calculation based on non-standardized series (c) and then only including PCs 1 and 2 in the climate reconstruction, this information was indirectly removed from the reconstruction. As shown in Figure S1, a climate reconstruction based on such a subset of PCs has not converged to a stable hemispheric temperature series. Rather, it gives a much warmer early 15th century when looking at the fully "assembled" 11-segment MBH reconstruction. As Wahl and Ammann (this volume, "WA") have pointed out, this reconstruction is invalid under all conditions we have examined: it does not pass hemispheric temperature-based validation, nor does it pass under a general version of the more detailed proxy-propagation method first proposed in MM05c, as shown in the main text of this article (cf. Section 3 of this supplement for full details).

The convergence shown in Figure S1 (bottom row) illustrates that only if at least 4 PCs are included does one get a valid reconstruction in this situation. That 2 PCs would have sufficed if the underlying 70 tree ring series would have been standardized prior to PC calculation is also seen in S1. This standardization is not automatically performed in the R-function princomp used by MM05a and MM05b, which caused the first few PCs to primarily reduce the large difference in variance (factor of 13) among the underlying ITRDB data series. Only then are common signals extracted. Both other standard routines for PC extraction in R (svd and prcomp) would have prevented this relegation of climate signal into lower PCs (as MM05b have recognized). In the end, the calculation method for PCs can only appropriately be a minor issue that causes the signal to be extracted from the noise across different orderings of the PC rankings. Fundamentally, the climate signal cannot significantly change between these methods, other than in terms of the ordering and combination of information in the PC series.


Figure S2: Standardized Principal Components of 70 ITRDB-tree-ring series computed with various methods: PC1 and PC2 for (a) MBH, (b) MM using standardized data and (c) PC1 and PC4 for MM05a using non-standardized data. Colors were chosen to indicate in red the "hockey stick"-like shape discussed in MM05a. It is clearly visible in all PC-calculation methods. In the MM-longterm centered but standardized calculation, the 20th-century trend is actually distributed into both PC1 and PC2. The lower right figure (d) shows the vector sums of PCs 1+2 under the different computation methods: MBH (black), MM-standardized (MM-revised, red) and MM-non-standardized (MM05a, blue). The difference between black and red is the bias introduced by the centering choice. Clearly, the shape is almost identical, but a small inflation of the amplitude is clearly visible. On the other hand, the blue MM05a (non-standardized) choice does not bear any resemblance to the other two vector sums.


Besides discussing PC extraction methods, MM05a have used the PC calculation to highlight a bias that is present in the MBH reconstruction. By using a centering convention that performs the PC extraction relative to the series calibration period average (1902-1980) rather than their full length (in this case 1400-1980), the MBH method slightly inflates the offset of the mean difference between the calibration period and the pre-calibration period. MM05a have illustrated this bias through comparison of the inflated PC1 from a random pseudoproxy network (based on full-spectrum red-noise persistence characteristics of the real ITRDB N-American network) with the MBH final Northern Hemisphere temperature, indirectly implying that the bias in the PC1 time series could be responsible for the overall shape of the MBH reconstruction (often dubbed the "hockey stick"). While we confirm the presence of such a bias at the level of the final reconstruction, averaging only ~0.05 degrees in the early 15th century period of key concern (WA; cf. main text of this article), the comparison of an inflated PC1 from a random network with the full MBH reconstruction is misleading. First, this comparison is incorrect because the bias does not, in fact, impose a "hockey stick" shape, but rather introduces a "crank shaft"-like shape (in the mean random case it consists of simply two separate mean values, one over the calibration period, the other before). Second, the PC1 series derived from the 70 ITRDB N-American tree ring series represents only one out of 22 predictor series employed in the 1400-1449 (or "1400") segment of the MBH reconstruction (both N-American PC1 and PC2 are used). Finally, the PC series are unitless time series that are not necessarily a temperature measure.

What the proxy PCs exactly represent is, in principal, irrelevant under the MBH method. They only influence the reconstruction if they correlate well with one or more of the PC time series related to the major empirical orthogonal function (EOF) patterns of instrumental surface temperature variability. Therefore, temperature, precipitation or a combination of the two, in theory, could equally be represented in the tree ring data, not to mention other climatic factors that could be involved as well, such as cloudiness, soil moisture, etc. We believe that a better illustration of the bias is achieved if one compares the MBH-centering PCs with full-length (MM) centered series. Figure S2d shows the vector sums of PC1 and PC2 for the two cases. Because in MBH's 1400-network only the first global EOF temperature pattern is reconstructed, the individual predictors (PC1 and PC2 from N-American ITRDB included) act as direct linear scalars in the reconstruction. It is clearly seen that there is some offset between the PCs calculated through the MBH and the MM centering conventions. This offset is a more objective measure of the bias than the visual counter-position shown in MM05a. From this figure, it is also clear that the difference is very small and the two vector sums have nearly identical structure over time; the differences between these PCs cannot explain the alternative reconstruction shown in MM05b.

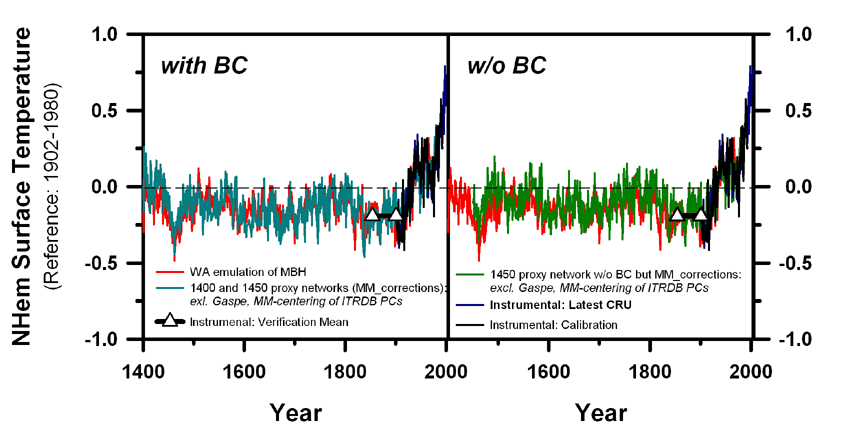
The difference in climate outcome resulting in a spuriously warm early 15th century (MM05b) arises because the reconstruction was based on non-standardized tree ring data summarized with the R-function princomp, which does not automatically perform standardization. Subsequently, MM05b chose only to include the first 2 PCs of the summarized tree ring data, as MBH did with PCs calculated from standardized data. This non-converged result from MM05b (Figure S1) is very similar to cases where the BC series are actively eliminated (WA). In fact, and MM05b acknowledge as much, a reconstruction using only PC1 and PC2 from the MM05b calculations equates to an indirect removal of the BC series. MM05b then go further by claiming that BC data contain spurious information in the 20th century and should therefore be eliminated from the reconstruction. We have argued for retention of the BC series and that they do not contain information that spuriously affects calibration (WA; main text of this article), but conservatively conclude the following (see Figure S3): if BC series are retained in the reconstruction matrix, then the reconstruction of MBH98 is valid and only a minor correction for the inflation of the mean offset prior to calibration originating from the centering convention would have to be applied; if BC series are eliminated from the reconstruction matrix, then the MBH reconstruction would have to start in 1450 rather than 1400 due to failure to verify in the 1400-network. No well-verified significantly warmer early 15th century temperatures can be achieved using properly converged reconstruction procedures, independent of centering convention or PC extraction method applied.


Figure S3: WA emulation of MBH with and without BC series.


3. R-Code for Benchmarking the Significance of Verification RE Statistics in the Wahl/Ammann Examination of the MBH and MM Climate Reconstructions.

Code, input data, and complete results for RE benchmarking using red noise propagation through the MBH/WA reconstruction algorithm are provided in the folder SignificanceThresholdAnalysis. Complete descriptions and notes are contained in the "READ_ME" file. The table below summarizes the results mentioned in the text from the benchmarking analysis.

Table S1 :Verification RE Significance Levels (all at 0.75 as a minimum threshold for the calibration/verification RE ratio): One minus the significance level shown gives the estimated chance of committing a Type I error of falsely rejecting the null hypothesis of no significance for each scenario.
Proxy Network (WA-emulation of MBH 1998)RE Significance Level
1400-network
0.99
1450-network
0.96
1500-network
0.95
1600-network
0.89
1700-network
0.95
1730-network
0.98
1750-network
1.0
1760-network
0.98
1780-network
1.0
1800-network
1.0
1820-network
1.0

MBH-1999/WA-emulation of 1000-year network RE-Significance Level
noCO2 correction, full-period-centered proxy PCs
0.94

MBH-NetworkWA-Scenarios and Signifiance Levels
5a 5b 5c 5d 6a 6b 6c
1400 0.94 0.77 0.74 0.26 0.31 0.27 0.27
1450 0.95 0.97 0.96 0.96 0.96 0.95 0.93

4. Some additional Information

We thought it might be helpful for readers to see a few additional illustrations:

Variances in N-American tree-ring series

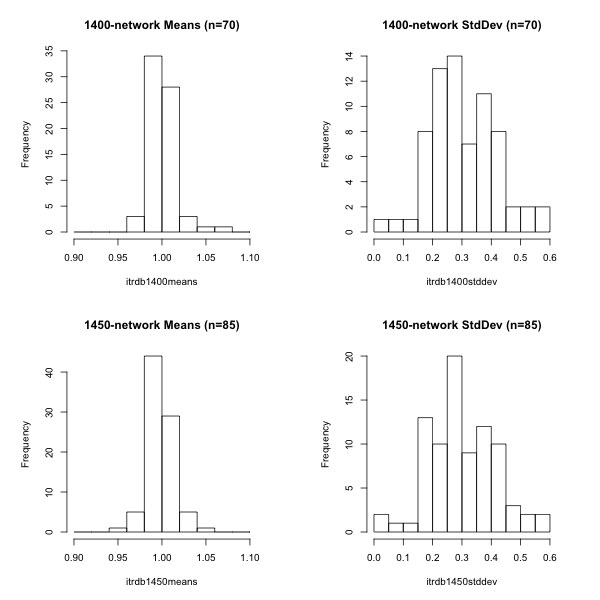
A core issue in the debate about the information stored in Principal Components of the 70 (1400-network) and 85 (1450-network) N-American ITRDB tree-ring series has to do with how the information is being separated by the PCs. As we have shown, not standardizing the raw series leads to very different separation of the information in the PCs. The following histogram shows the distribution of the individual tree-ring series variances as used directly in MM05a/b. Normalized series should show a mean of "0" and variance "1". While MBH98 uses the same series, they standardized the individual records before applying them in the Principal Component Analysis (SVD), the series going into the MM05a/b calculations are not.

Figure S4: 1400 and 1450 networks Raw Means and Variances


For the 1400-network the individual variances differed by a factor of 13.


Effect of centering-related offset

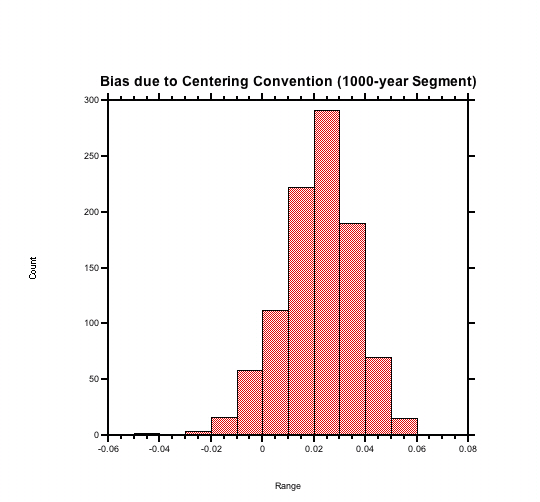
To illustrate the effect of the centering-related offset (bias), we have shown in Figure 2 that the shape and the interpretation of the corrected N-Hemisphere reconstruction remain effectively unaltered. The following histogram summarizes the annual differences between the original (WA-original) and the corrected reconstruction at the Millennial scale (MBH99).

Figure S5: Centering Bias over Millennium

One can see that the correction of MBH99 is of the order of +/- 0.02 (mean 0.023) degrees C.
Last modified: Mon Jul 7 22:13:30 MDT 2008